
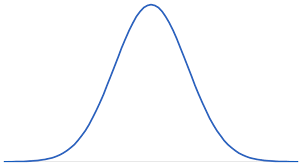
The normal distribution is one of the most famous statistical distribution in use. The normal distribution is a continuous probability distribution.
Formula

For Example:
- Height of people: The height of the people is from low to high. So it follows the normal distribution.
- IQ: Today there is a lot of competition everywhere like in Jobs, Businesses, Colleges, etc. The Intelligent Quotient level varies from person to person. So the IQ level of all people is not the same. It follows the bell shapes curve.
- Tossing a coin: When tossing a coin, there was the equal possibility of head and tail.
- Blood pressure level
- Technical Stock Price
- Cloth Size
- Weight
- Student’s Report
Properties of Normal Distribution
- A continuous random variable x has a normal distribution if its value falls into a bell-shaped curve.
- Every normal distribution has its own mean and standard deviation.
- The normal distribution is defined by its mean and standard deviation.
- The shape of the normal distribution is symmetric around the mean.
- The area under the curve is one.
- The normal distribution is denser in the center and less.
- 50% less than the mean and 50% more than the mean.
- It has zero skew and kurtosis of 3.
- In a normal distribution, the mean is zero, and the standard deviation is 1.
The normal distribution is mound-shaped; it follows the empirical rule:
- 68% of the area of a normal distribution is within one standard deviation of the mean
- 95% of the data are within two standard deviations of the mean
- 99% of the data are within three standard deviations of the mean.
Every Data is distributed in a different way Like
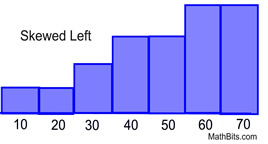
It can be spread out on the left 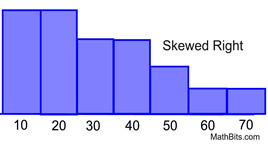
Spread out on the right
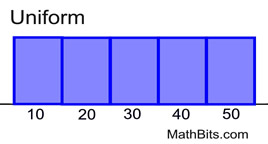
Or it can be jumpled

The data is represented by the central value with no bias left or right is known as Normal Distribution

How to use Normal Distribution in Python
from scipy import stats
stats.norm.cdf(x, loc=mean, scale=std)
Example of stock price
To understand the normal distribution and its application, here in the data, we try to understand the risk and return associated with various stocks before investing in them.
for analysis, we evaluate two stock State Bank of India(SBI) and HDFC Bank
I extracted the data from yahoo finance, i.e. SBI & HDFC.
The question we conclude with normal distribution is:
- What is the expected daily rate of return of the SBI and HDFC?
- Which stock has a higher risk of volatility as far as daily return are concerned?
- Which stock has a higher probability of making a daily return of 2% or more?
- Which stock has a higher probability of making a daily loss(risk) of 2%?
Open your Jupyter notebook on you PC and start
Import the library
import pandas as pd
import numpy as np
import matplotlib.pyplot as plt
import seaborn as sns
Read the csv file with the pandas library
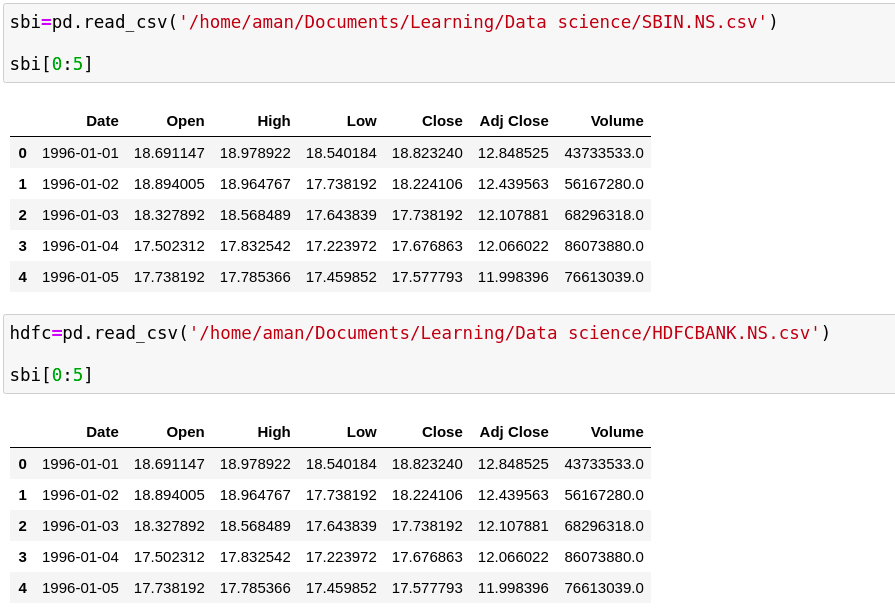
Here in the data, there is various columns are present so we want only Date and Close Price.
sbi=sbi[['Date', 'Close']]
hdfc=hdfc[['Date', 'Close']]
The DataFrames have a date column, so we can create a DatetimeIndex from this column Date. It will ensure that the rows are sorted by time in ascending order.
sbi=sbi.set_index(pd.DatetimeIndex(sbi['Date']))
hdfc=hdfc.set_index(pd.DatetimeIndex(hdfc['Date']))
To answer the above question, we must find out the behavior of daily return on these stocks. The gain can be calculated as a percentage change in close price from the previous day’s close price.
Gain= Close price – close price previous day/close price previous day
The method pct_change() in pandas will give the percentage change in a column value shifted by a period which is passed as a parameter to period.
sbi['gain']=sbi.Close.pct_change(periods=1)
hdfc['gain']=hdfc.Close.pct_change(periods=1)
After collecting the gain column of all the days let’s find out the question answer.
Drop the NaN row
sbi = sbi.dropna()
hdfc = hdfc.dropna()
Recognizing that the stock data is following the Normal Distribution or not
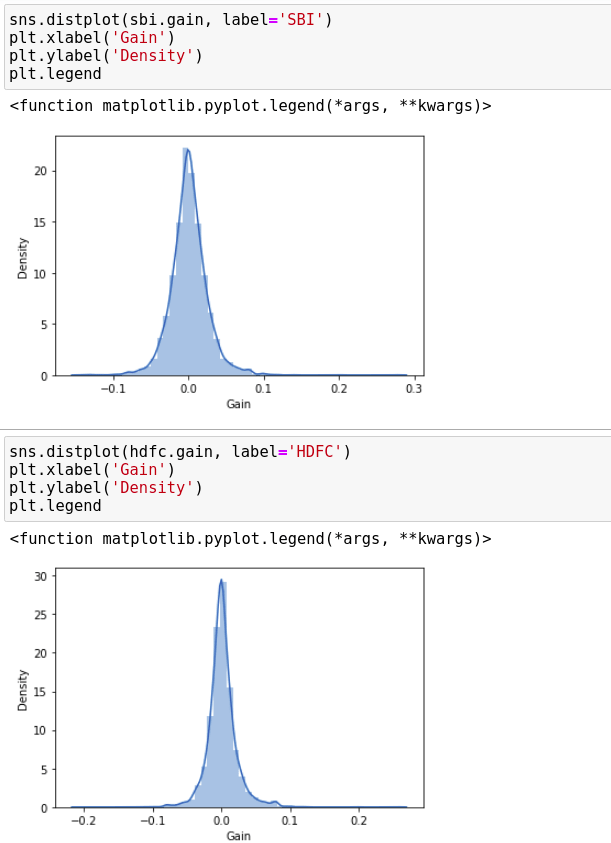
Both include the bell-shaped curve, so we can say both follow the Normal Distribution.
1. What is the expected daily rate of return of the SBI and HDFC?
The daily average of SBI is 0.08% and HDFC bank is 012% that means both stocks with a mean of around 0.00.
print('Mean of SBI in 4 digit:', round(sbi.gain.mean(), 4))
print('Mean of HDFC Bank in 5 digit:', round(hdfc.gain.mean(), 4))
output:
Mean of SBI in 4 digit: 0.0008
Mean of HDFC Bank in 5 digit: 0.0012
2. Which stock has a higher risk of volatility as far as daily returns are concerned?
The expected daily rate of return is around 0% for both stocks.
SBI seems to have a bit high Standard deviation than HDFC which means SBI is extra volatile than HDFC.
print('Standard Deviation of HDFC Bank in 4 digit:', round(hdfc.gain.std(), 4))
print('Standard Deviation of SBI in 4 digit:', round(sbi.gain.std(), 4))
output:
Standard Deviation of HDFC Bank in 4 digit: 0.0218
Standard Deviation of SBI in 4 digit: 0.0245
3. Which stock has a higher probability of making a daily return of 2% or more?
To calculate the probability of gain higher than 2% or more, we need to find out what is the sum of all possibilities that gain can take values more than 0.02(i.e. 2%).
- Probability of making 2% gain or higher in SBI is 0.21 i.e 21%
- Probability of making 2% loss or higher in HDFC: 0.19 or 19%
Probability of making 2% gain or higher in SBI
1 - stats.norm.cdf(0.02,
loc=sbi.gain.mean(),
scale=sbi.gain.std())
Output: 0.21601139851584394
#Probability of making 2% gain or higher in HDFC
1 - stats.norm.cdf(0.02,
loc=hdfc.gain.mean(),
scale=hdfc.gain.std())
Output: 0.19419697094963984
4. Which stock has a higher probability of making a daily loss(risk) of 2% or more?
To calculate the probability of loss higher than 2% or more
- Probability of making 2% loss or higher in SBI is 0.20 i.e 20%
- Probability of making 2% loss or higher in HDFC: 0.16 or 16%
from scipy import stats
#Probability of making 2% loss or higher in SBI
stats.norm.cdf(-0.02,
loc=sbi.gain.mean(),
scale=sbi.gain.std())
Output: 0.19765305102205522
#Probability of making 2% loss or higher in HDFC
 stats.norm.cdf(-0.02,
 loc=hdfc.gain.mean(),
 scale=hdfc.gain.std())
Output: 0.16521895907544343


