

Exploratory data analysis is analyzing data sets to summarize their main characteristics by using statistical graphics and other data visualization methods.
There are various ways to analyze the data are as follows:
- Describe a dataset: Number of rows/columns, missing data, data type, preview.
- Clean data: Handle missing data, invalid data type, incorrect values, and outlier
- Visualize data distributions: Var charts, histogram, box plots
- Calculate & visualize: Correlation (relationship) between variable, heat map
Data Cleaning
Data cleaning is the process of detecting and correcting unreliable or inaccurate records from a recordset, table, or database. It refer to identifying incomplete, incorrect, inaccurate, or irrelevant part of the data and then replacing, modifying, or deleting the dirty or coarse data.
Data quality: validity, accuracy, completeness, consistency, uniformity.
Validity of the Data
Data type constraints: Value in a particular column must be of a specific data type, e.g., boolean, numeric, data, etc
Range constraints: Typically, numbers or dates should fall within a specific range.
Mandatory constraints: Several columns cannot be empty like Age, Gender, or any other. The value of a column comes from a set of discrete values, for example, a Gender group fixed set of three values.
Regular expression patterns: Text field that has to be in a specific pattern; for example, the phone number may be required to have the pattern (999)999 9999.
Crossfield valuation: A particular condition that spans multiple fields. For example, a Student’s date of leaving from the school can not be earlier than the date of admission.
Data Accuracy
The degree to which the data is close to the actual values. While defining all possible valid values, allows invalid values to be easily spotted, it does not mean that they are accurate. A valid street address mightn’t exist. Another thing to note is the difference between accuracy and exactness. Saying that you live on the earth is actually true. But not exactly where on the earth? Saying that you live at a particular street address is more accurate.
Consistency and uniformity
The degree to which the data is compatible within the same data set or across multiple data set. Incontinence occurs when two values in the data set differ from each other. A valid age, like the age of 7 mightn’t match the marital status, If the person more than 21 then we can say the possibility of marital status.
A customer is recorded in two different tables with two different genders Which one is true? The degree to which the data is specified using the same unit of measure. The date might follow the USA format, Indian format, or European format, or any other. The currency is sometimes in USD, INR, Dharam, and sometimes in euros And so data must be converted to a single measure unit.
Outlier
Outlier is data that is distinctively different from other observations. They could be real outliers or mistakes. How do you find out? Whether the feature is numeric or categorical, we can use a different technique to study its distribution to detect outliers:
Histogram/ Boxplot: When the feature is numeric, we can use a histogram and box plot to detect outliers. If the data is highly skewed from the histogram, then there is a [pssobooty of outlier and confirm with the box blot.
Descriptive statistics: Also, for numeric features, the outlier could be too distinctive. We can look at their descriptive statistic. For example, for the feature ozone, we can see that the maximum value is 168, while the 75% quartile is only 68. The 168 value could be an outlier
Python code: Code: data-cleaned3['ozone'].describe()
Barchart: when the feature is categorical. We can use a bar chart to learn about its categorical and distribution. E.g., the feature month has a reasonable distribution except for category2. The 2nd-month column has only one value. This can be an outlier. What to do? While outlier is not hard to detect, we have to determine the right solutions to handle them. It highly depends on the data set and the goal of the project. The method of handling outliers is somewhat similar to missing data. We either drop a adjust or keep them. We can refer to the missing data sections for possible solutions.
Data cleaning steps:
- Duplicate rows.
- Rename the columns.
- Drop unnecessary columns.
- Convert data types to other types, removing strings in columns.
- Change the data types, outliers.
What is a missing value?
Some of the values will be missed in the data because of various reasons such as human error, machine failure, etc.
Here I have taken the Amazon sales data for visualization and pandas library for reading the file.
And the Data look like 186850 rows and 6 columns

How to find missing values:
I use the code: data.isna().sum() : Shows that the 545 is the mission value in the data.

data[data.isnull().any(axis=1)] : Visualize the missing value in the data
![data[data.isnull().any(axis=1)] : Visualize the missing value in the data](https://shitus.com/wp-content/uploads/2021/10/3-data.png)
How to Visualize the missing Value in data
We can visualize the missing value in the data by the various algorithm. The easiest and useful is missingno algorithm. so import missingno as msno
python Code:
import missingno as msno
%matplotlib inline


How to treat the missing value:
Here I have taken the Amazon seller data that has 186850 rows and 6 columns. And here 545 missing values that are less than 0.3 percent. so we can drop the entire observation if it contains a missing value.
Only delete the missing value if you are sure that the missing data is not informative, otherwise we should consider other solutions.
Treating missing value code:
dropna() : Drop missing observation
dropna(how=’all’) : Drop observation where all cells is NA
dropna(axis=1, how=’all’) : Drop column if all the values are missing
dropna(thresh=8) : Drop rows that contain less than 8 non-missing values
fillna(0) : Replace missing values with zeros
isnull() : return True if the values is missing
notnull() : Return True for non-missing values
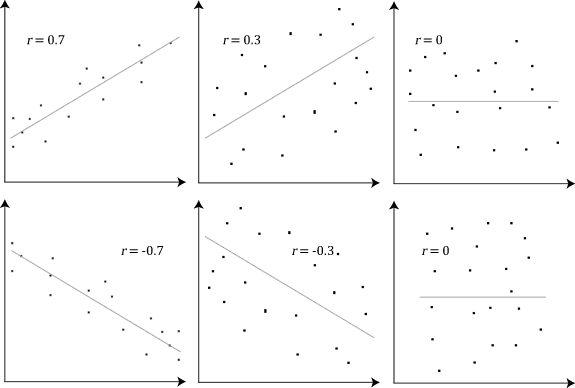
Scatter plot or Correlation
In a scatter plot(Aka scatter chart, scatter graph), dots represent values for two different numeric variables. scatter plots are used to observe the relationship between variables.
The formula for correlation is

- Positive correlation: In positive correlation variable-1 increases and then variable-2 is also increased.
- Negative correlation: Variable-1 increases then Variable-2 decreases.
- No changes occur Variable-1 increasing then Variable-2 flat or no changes occur.
Here a few examples of correlation: Negative sign indicates that the negative correlation and the positive indicates a positive correlation and zero indicates that no correlation.
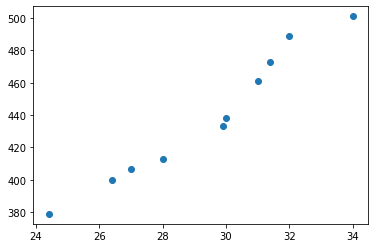
For example, In an ice cream parlor, the Ice cream sales are increasing in a season when the temperature is increasing.
| Temperature | Ice cream sales ($) |
| 26.4 | 400 |
| 29.9 | 433 |
| 24.4 | 379 |
| 31.4 | 473 |
| 32 | 489 |
| 27 | 407 |
| 28 | 413 |
| 31 | 461 |
| 30 | 438 |
| 34 | 501 |
When we visualize the temperature and sales in the jupyter notebook, this looks like:
a= 26.4, 29.9, 24.4, 31.4, 32, 27, 28, 31, 30, 34
b= 400, 433, 379, 473, 489, 407, 413, 461, 438, 501
Python code:
#Import the visualization library
import matplotlib.pyplot as plt
import seaborn as snsPlot the graph:
plt.scatter(a, b)
plt.show()
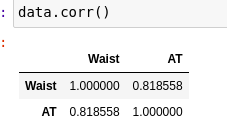
Person correlation: correlation is a bi-variate analysis that measures the strength of linear association between two variables and the direction of the relationship. Correlation is a statistical technique used to determine the degree to which two variables are linearity related.
For finding the correlation value you can directly put the code: df-attribuute.corr()
like here I found the correlation between waist and AT
Feature scaling
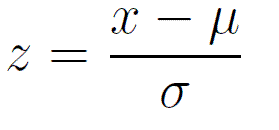
Some machine learning algorithms are sensitive to feature scaling means the result will vary based on the units of the features, so remove the effect of scaling. It is required to go for feature scaling.
Standardization (Z-score): standardization is a scaling technique where the values are centered around the mean with a unit standard deviation
-3 to +3
Formula:
Normalization: is a scaling technique in which values are shifted and rescaled so that they end up ranging between 0 and 1, It is also known as minimax scaling -2 to +2, or we can modify.
Xse= x-xmin/xmax-xmin
Automatic EDA methods
Exploratory data analysis (EDA) is an essential step in most data science projects, and it often consists of taking the same steps to characterize a dataset (e.g. find out data types, missing information, distribution of values, correlation, etc.)
Libraries help speed ar the process and automatic:
Libraries: pandas profiling & sweetviz

