I ask my friend today about the mean, median, and mode, but they didn’t correctly answer me. So I decided to prepare a guide for the mean, median, and mode. In statistics, the mean, median, and mode are the most uses method for finding an average number. As you read this guide, you will get how to use this method properly in real life or python. Before going further, understand the basic symbol ∑ =Summation X= Observations N= number of observations
Mean
This is the most used average method. Addition the total number and divide it by the number of observations. Mean is denoted by x̅
Formula: x̅= ∑x/N =X1+X2+…..Xn/N
Example: Find the mean of 1, 2, 3, 4, 5, 6, 7, 8, 9
Formula: x̅= ∑x/N = X1+X2+…..Xn/N
x̅= 1+2+3+4+5+6+7+8+9/9 = 5
Mean In python:
we can find with two python module that based on the condition. So we use both modules
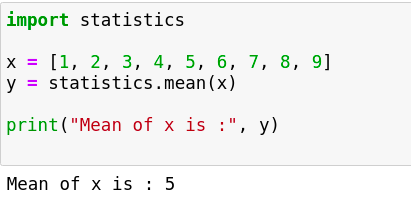
1.Statistics module: From this, we can do various numerical operations, Install the module by pip install statistics in your python Command prompt, or if you are using Jupyter notebook, you can install by !pip install statistics. After installation, import the statistics module as shown in the image. Here I created x is the list of numbers, and in y, I apply the mean function, and at the end, I printed the value.
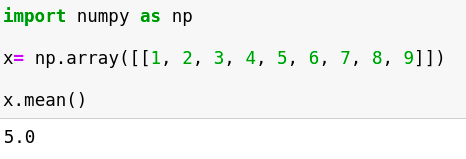
2. Numpy: Numpy is the most famous python library that uses in all numerical operations. Numpy is helpful for the small as well the large set of data. When you install the python, the NumPy library is default installed, or if not detected, you can install by pip install numpy. Import the library as import numpy as np and make sure do not make spelling mistakes.
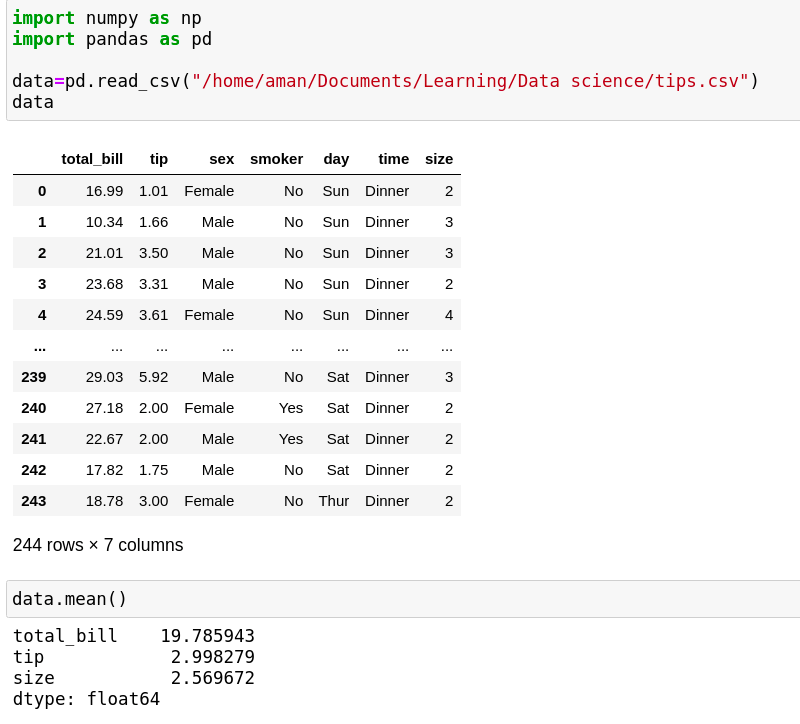
3. A large set of data: If you have the CSV, SQL, or any other file, you can also find the mean inside the file. First, you have to import pandas as pd for reading the file, create a data frame as seen in the image, and read the file with pd.read_csv. Here I assume an example of a CSV file; you can take your own like SQL, SAAS, or whatever.
Median
Sometimes the mean will not work like 1+7+9+1+2, and 3+5+6+1+5 has the mean four, but the fluctuation is high. So we can move for the mode and median to calculate. Our main goal is to find a perfect average that helps the data to identify a great decision.
For finding the median, sort the data in ascending order. If N is an odd value, we can say the middle is the median value or if the N is even, then calculate the average of two middle values. Example: 11, 12, 11, 14, 11, 14, 12, 12, 15 ,16, 15, 17 Arrange in ascending order: 11, 11, 11, 12, 12, 12, 14, 14, 15, 15, 16, 17 Data is even so select the middle two value 13 and 14 and divide it by two. 12+14/2= 13.16
Median in python
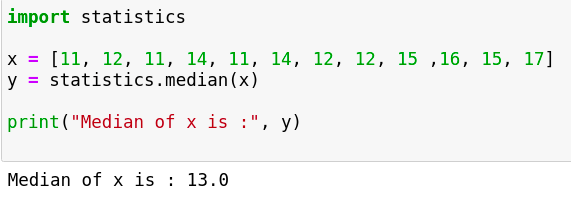
1.Statistics module: import the statistics module as shown in the image. Here I created x is the list of numbers, and in y, I apply the median function, and at the end, I printed the value.
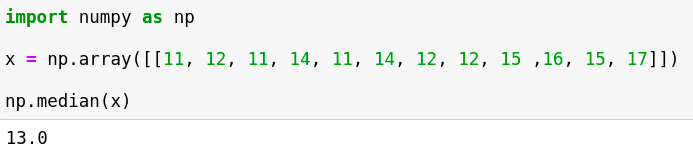
2. Numpy: Import the library as import numpy as np
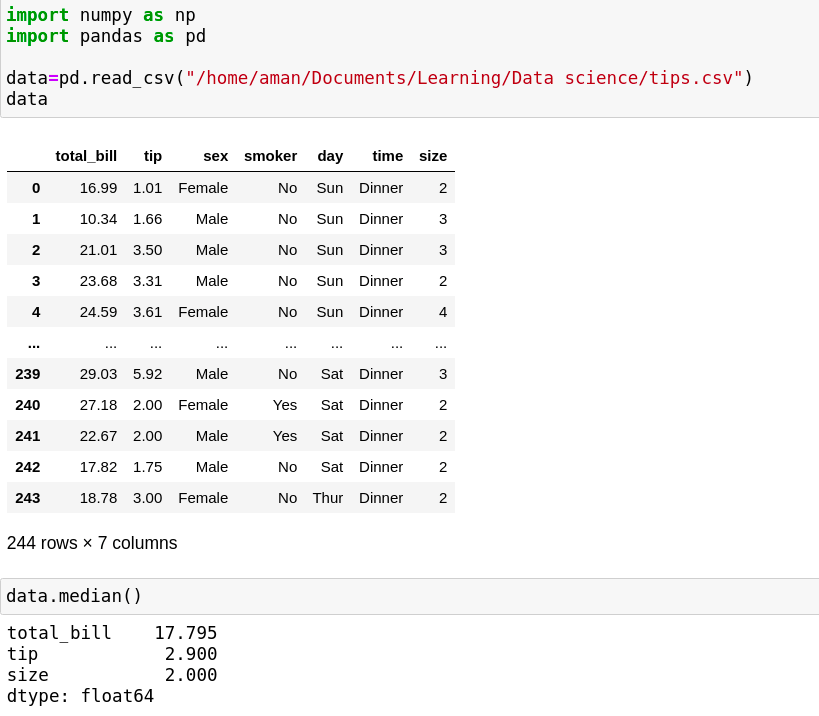
3. A large set of data: All are the same as mean; replace the mean from the median you will get.
Mode
The mode value is the most repeating value. Example: 2,5,3,4,5,5,4,7
Here five are repeating three times, so five is the mode.
In some mathematic calculation require multiple mode value Example:
Bi mode: 1,2,2,3,2,3,4,6
Here the 2 and 3 are repeating two times, so we can say these are the mode.
Multiple mode: 1,2,2,10,12,11,12,10,6,11
Here the 2, 10, 12 are repeating, so we can say this is the mode.
Range
The difference between the largest value and the smallest value contained in the data set. First, record the smallest value and largest in the data set, subtracting the largest from the smallest value.