
| Covaxin | Bharat Biotech |
| 76.12 | 77.4 |
| 77.45 | 79.21 |
| 74.81 | 77.69 |
| 78.11 | 73.2 |
| 77.21 | 77.21 |
| 78.26 | 78.89 |
| 76.5 | 78.4 |
| 82.63 | 81.64 |
| 78.33 | 73.12 |
| 80.12 | 80.06 |
| 77.2 | 76.93 |
| 78.06 | 79.85 |
Can we say that the efficacy of Covaxin is greater than Bharat biotech?
Descriptive Statistics
| Variable | Vaccine Name | N | Mean | Std.Dev |
| Efficacy | Covaxin | 12 | 77.9 | 1.98 |
| Bharat Biotech | 12 | 77.8 | 2.55 |
| Develop the hypothesis for the population and make statistical decisions by determining the hypothesis using sample data. | Example: Covaxin is effective than the Bharat biotech vaccine developed by the different pharmaceutical companies. |
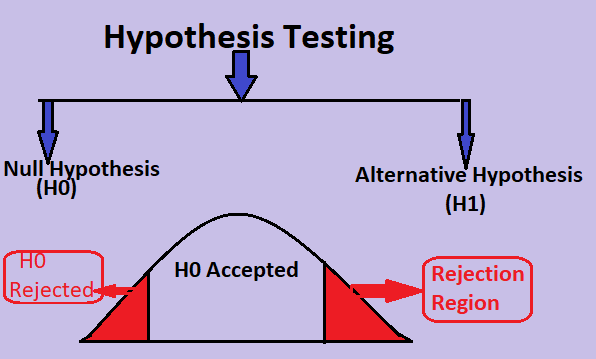
| Null hypothesis (H0): Argument made so far, or hypothesis saying that there is no change or difference | H0: Covaxin and Bharat biotech vaccines have the same effect |
| Alternative hypothesis (H1): New argument that you want to prove from a sample | H1: Covaxin has more effect than Bharat biotech vaccines |
What is Hypothesis testing?
Hypothesis testing is a statistical method that is used in making an analytical decision using experimental data. Hypothesis testing is an assumption that we make about the population parameter.
E.g.,
- The average height of residents in the city is more than 5.6 feet.
- Votes for the political party will be more than 58%
Formula:

Procedure of hypothesis
The step for hypothesis tests are as follows:
- Define null and alternative hypothesis
- Identify the test statistic to be used for testing the validity of the null hypothesis, for example, Z-test or t-test. If the value is more than30, then we use the t-test; unless, Z test.
- Decide the significance value (α). The standard value used for α is 0.05.
- Calculate the p-value(probability value), that is, the conditional probability of observing the test statistic value when the null hypothesis is true. We will use the functions provided in scipy.stats module for calculating the p-value.
- Take the decision to reject or retain the null hypothesis based on the p-value and the significance value a.
What is a null hypothesis?
A null hypothesis is a statistical method used in a hypothesis test that intends no difference between specific populations.
H0 denotes the null hypothesis.
The Null hypothesis defines that in the experiment, everything is ok. There is no need to take action.
What is an alternative hypothesis?
The alternative hypothesis states there is no statistical relationship between the two variables.
H1, HA denote the alternative hypothesis
often a claim to be tested or a change to be detected
Python code for hypothesis test
from scipy import stats
stats.norm.cdf(z)
stats.t.cdf(t, df=10)
Real-life Example of Hypothesis Testing
1. A supermarket plans to launch a loyalty program if it’s average spending per shopper is more than $126 per week. A random sample of 90 shoppers enrolled in the pilot program spent an average of $140 in a week with a standard deviation of $43. Should the loyalty program be launched?
calculate by using the formula
First, calculate the t

140-126/43 √90= 3.08
Code:
 from scipy import stats
 1-stats.t.cdf(3.08, df=90)
Output: 0.0013726426439238937
P < α
0.00 < 0.05
Null hypothesis is rejected
So we have to launch the Loyality program
Example 2: Process control at a call center
A call center is connecting a day about 600 calls.
The head office of that call center is monitoring by the average call duration that are given in the table.
Data from 24 month shows that on thee day when the process runs normally is 4min and the standard deviation is 2.7
| Day | Mean Call Duration |
| 1 | 4.2 |
| 2 | 4.1 |
| 3 | 3.8 |
| 4 | 3.6 |
| 5 | 2.8 |
| 6 | 3.8 |
| 7 | 6.2 |
| 8 | 2.7 |
| 9 | 3.7 |
| 10 | 2.2 |
| 11 | 4.4 |
| 12 | 5.2 |
| 13 | 5.4 |
| 14 | 5.3 |
| 15 | 4.6 |
| 16 | 3.7 |
| 17 | 3.9 |
| 18 | 4.6 |
| 19 | 2.9 |
| 20 | 4.1 |
Solution:
Mean (μ) =4
STD (s) = 2.7
Sample size (n) = 600
Sample mean (x̄) = 4.2
The company cannot monitor every call in a call center, so they can calculate by Hypothesis testing to recognize the call center performance.
We already know the sample mean every day will be different, but when should be alarmed and conclude that system is not working regularly. Hence we use the 2 tail t-test.
So I directly run the python code are as follows:
import scipy
 import numpy as np
 t_test = (4-4.2)/(2.7/np.sqrt(600))
 t_test
Output: -1.8144368465060594
from scipy import stats
2*stats.t.cdf(-1.81, df=599)
Output: 0.07079681295383963
The probability of a sample mean of 4.2 is 0.07
If I reject the null hypothesis that is 4 min, I will be wrong with a probability of 0.07
I cannot conclude that the process has changed that do not investigate.
If you are grave to learn the Hypothesis testing, you can take another example given in the table and comment your answer. I will definitely reply you.
Example- one Tail t-test
An outbreak of E Coli(Escherichia coli)-related illness was attributed to ice cream produced at a certain factory. Scientists measured the level of Ecoli in 10 randomly sampled batches of ice cream. The level (in cfu/g) were 0.282, 0.341, 0.261, 0.392, 0.392, 0.429, 0.731, 0.487, 0.2891, 0.421. Is there evidence that the mean level of Ecoli in the ice cream is greater than 0.3 cfu/g?
Let be the mean level of E.coli in all batches of ice cream. Here the hypothesis of interest can be expressed as:
H0 : <= 0.3 Ha : > 0.3
Python code:
Data = pd.series([ 0.282, 0.341, 0.261, 0.392, 0.392, 0.429, 0.731, 0.487, 0.2891, 0.421 ])
scipy.stats.ttest_1sample(data, 0.3)
Output: Ttest_1sampResult(statistic=2.376171252487902, pvalue=0.0414872282881523)
0.041 < 0.05
The level of E.coli in ice cream is high as per the hypothesis test.
So we have to take action against the company.
Two sample t-test: Referernce
Six subjects have given a drug (treatment group) and an additional six subjects a placebo (control group). Their reaction time to a stimulus was measured (in ms). We want to perform a two-sample t-test for comparing the means of treatment and control groups.
Control :91, 87, 99, 77, 88, 91
Treat : 101, 110, 103, 93, 99, 104
Control=pd.series([91, 87, 99, 77, 88, 91])
Treat = pd.series([101, 110, 103, 93, 99, 104])
stats.ttest_ind(control, treat)\
Output: Ttest_indResult(statistic=-3.445612673536487, pvalue=0.006272124350809803)
P= 0.006 < 0.05
Reject H0

")

